Echogram#
How do echoes “look” like? Just like the spectrogram that provides a visual representation of sound, we can color-code the receiving echoes across “pings” (or sonar transmissions) to assemble echogram as a visual representation of echoes.
In a monostatic configuration when the propagation environment is simple (i.e., constant sound speed), we can use the delay from the time of sound transmission to the time an echo is received (\(\Delta t\)) to map out the distance between the transducer and the scatterer source (\(\Delta d\))
where \(c\) is the sound speed and the factor of 2 captures the roundtrip propagation path length.
For example, below is a sketch of how an echogram is assembled for a fish swimming up toward a downward-looking echosounder:

Echogram is an interesting plot, because both the vertical and horizontal axis are in the unit of time: the vertical axis are the global time of each ping, and the horizontal axis are the local time measured from the start of each ping.
Echogram examples#
Depending on the instrument and the measurement geometry, echograms can take many forms.
Vertical-looking systems#
When sonar systems are aimed vertically, either downward from the sea surface or upward from the seafloor, the echograms are typically plotted as a sheet that cuts across space (when the sonar is on a moving platform) or just across time (when the sonar is fixed).
For example, below is an echogram from by a ship-mounted, downward-looking fisheries echosounder, with the horizontal axis being the distance traveled across pings.

The same echosounder can be moored (fixed) on an underwater platform looking upward, producing a similar echogram with the horizontal axis being ping time.

In both cases, the vertical axis is range from the transducer, which can be transformed to depth once we compensate for the depth of the transducer itself.
Note
How do we know what’s in an echogram? Usually we rely on acoustic scattering models and contextual information about the environment to guide our interpretation. Learn more about these models in the Acoustic scattering section.
Horizontal-looking systems#
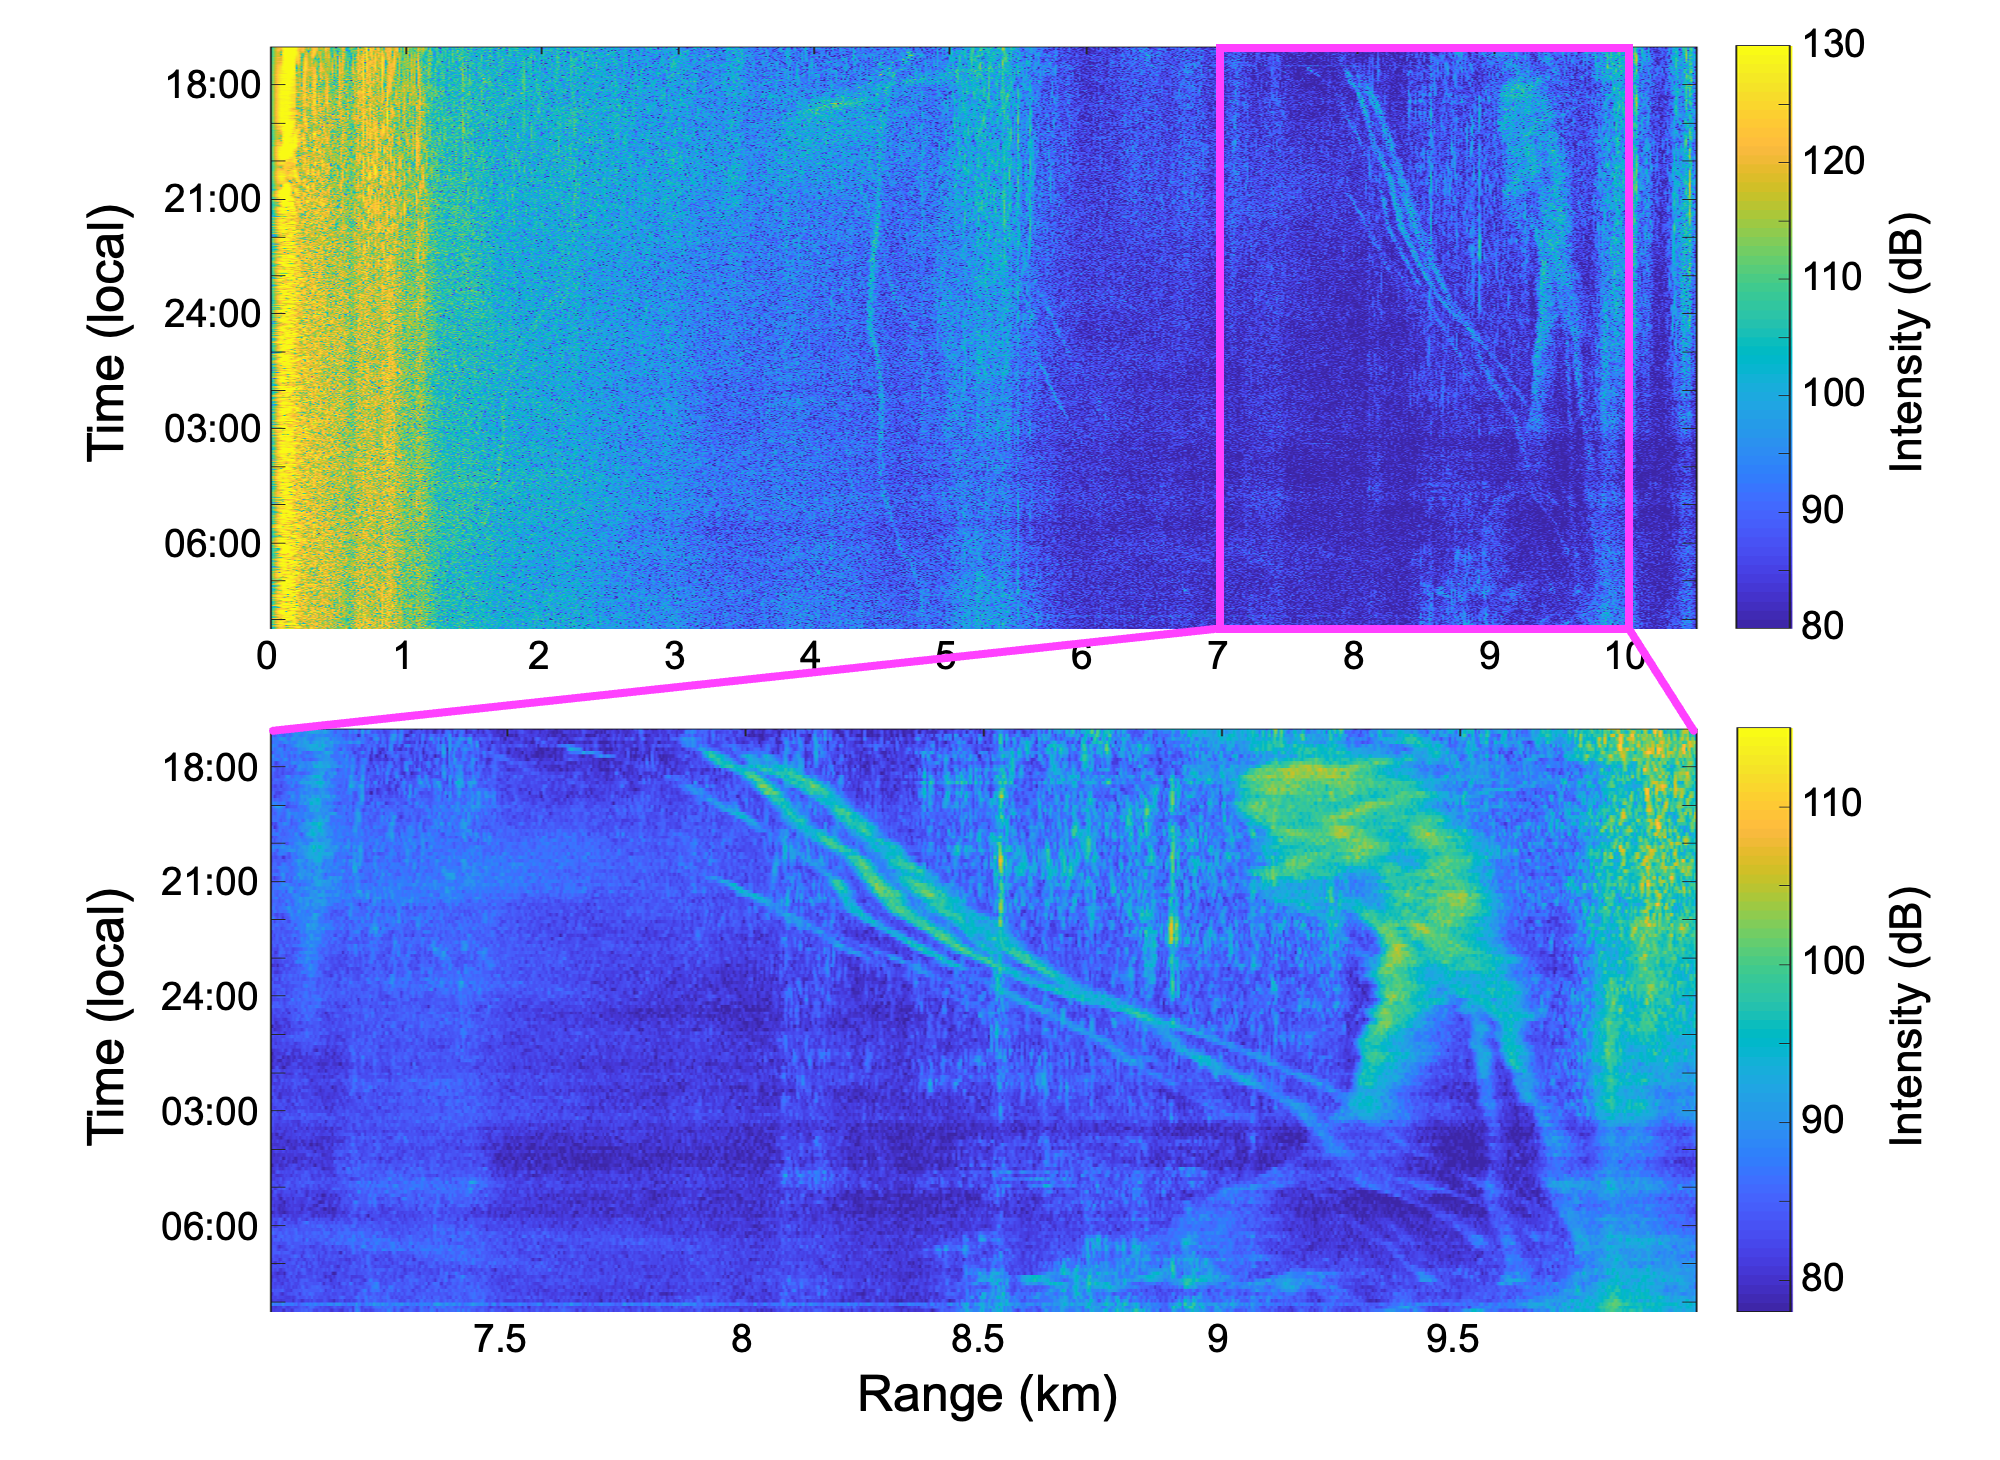
If the sonar is aimed sideways, which is typical for systems optimized for long range observation), the echogram is usually rotated sideways to align with our intuitive understand of the space.
For example, below is an echogram from a horizontal-looking sonar system aimed toward a specific direction in a coastal inlet. Different from the above, the vertical axis is now ping time and the horizontal axis the range from the transducer.
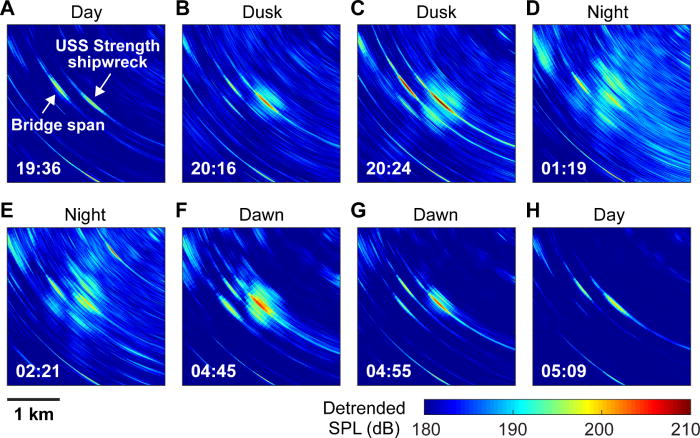
If the horizontal-looking sonar system has multiple “beams” looking into different directions, we can generate echograms by aligning all echoes generated from the same ping across angles. For example, below are a series of such echograms centered around the sonar system in a bird’s-eye view. Each echogram is a “snapshot” of the envronment from a single ping, showing fish emerging and spreading from artificial reef around dusk (from this paper).
Tip
See the Beampattern page to learn more about the concept of sonar beams!