Sound pressure metrics#
Most sound recordings consist of a series of voltage measurements. How do we choose a point to calculate the SPL, and is that even the right way to do it?
Indeed, usually we do not report a single point on a voltage time series, but use a metric or a descriptor. Most metrics are based either directly on sound pressure, or on sound intensity \(I\), which is proportional to the square of sound pressure (\(I = \frac{p^2}{\rho c}\)).
Precisely because the goal is to quantify sound received in a time series, you will notice the time period under consideration (\(T\)) in all of the common metrics below:
Root mean square (RMS) pressure#
where \(p(t)\) is pressure at time \(t\).
When working with discrete samples, this becomes
where \(p[n]\) is the \(n\)th pressure sample.
The unit of RMS pressure is [Pa].
Peak-to-peak (p2p) pressure#
where \(p_\textrm{max}\) and \(p_\textrm{min}\) are the maximum and minimum pressure during the time period under consideration.
The unit of p2p pressure is [Pa].
Energy flux density (EFD)#
The EFD measures the total acoustic energy passing throuhg a unit area over time:
or
Different from RMS and p2p pressure, the EFD is a cumulative measure and has a unit of [J/m2s].
Related to the EFD (since \(I = \frac{p^2}{\rho c}\)), the sound exposure level (SEL) measures the total energy of a sound event (including both the level and the duration), and allows sound exposures of different durations to be related to one another.
where \(T_0\) is typically 1 s and \(p_0\) is 1 μPa, making the unit dB re 1 μPa2s in water. However, when considering sound exposure, an animal’s hearing ability across frequency should be considered, giving rise to the weighted sound exposure. See this paper for detailed explanation.
RMS via direct computation#
To get a better feel for how we use these metrics, let’s calculate and compare the difference of RMS voltage measured by an Orcasound hydrophone on San Juan Island, WA between two time periods: one with only the quiet background and the other when a ship passed by.
Let’s first load the data:
import matplotlib.pyplot as plt
import numpy as np
from scipy.io import wavfile
import IPython.display as ipd
ship_fname = "../resources/ship_small.wav"
bkg_fname = "../resources/background_small.wav"
# Background
ipd.Audio(bkg_fname)
# Ship
ipd.Audio(ship_fname)
def proc_sound(fname):
    fs, sig = wavfile.read(fname)
    sig = (sig.astype(float) - 2**7) / 2**7
    t = np.arange(sig.size) / fs
    return sig, fs, t
Caution
We converted the signal to float to avoid integer overflow. Try to do the calculation with integers, and notice the difference.
sig_ship, fs_ship, t_ship = proc_sound(ship_fname)
sig_bkg, fs_bkg, t_bkg = proc_sound(bkg_fname)
fig,ax = plt.subplots(1, 2, figsize=(8,3), sharey=True)
fig.subplots_adjust(wspace=0.1)
ax[0].plot(t_ship, sig_ship, lw=0.5)
ax[1].plot(t_bkg, sig_bkg, lw=0.5)
ax[0].set_title("Ship")
ax[1].set_title("Background")
ax[0].set_xlabel("Time (sec)")
ax[1].set_xlabel("Time (sec)")
ax[0].set_ylabel("Volt")
plt.show()
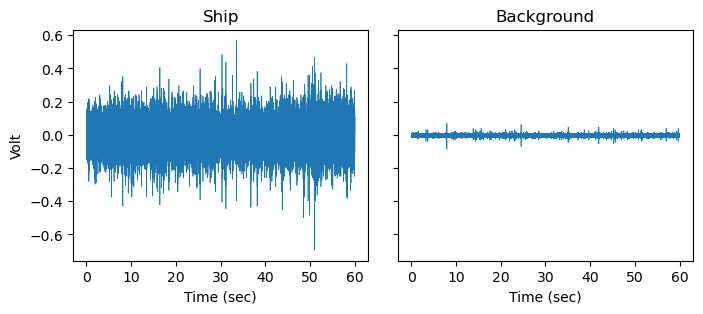
Visually, we can already see that it was much much louder when the boat was passing by.
def compute_rms(sig, sig_type):
    rms = np.sqrt(np.mean(np.square(sig)))
    print(f"The RMS voltage of the {sig_type} signal is: {rms:.4f} V")
    return rms
rms_ship = compute_rms(sig=sig_ship, sig_type="ship")
rms_bkg = compute_rms(sig=sig_bkg, sig_type="background")
The RMS voltage of the ship signal is: 0.0577 V
The RMS voltage of the background signal is: 0.0061 V
To compare how much these two time period differ in decibel, we need to do the following:
diff_db = 20 * np.log10(rms_ship/rms_bkg)
print(
    f"The ship is louder than the background by {diff_db:.2f} dB, \n"
)
The ship is louder than the background by 19.53 dB,
Exercise
Following from the above, based on your understanding of decibel:
What is the ratio of RMS voltage etween the ship and the background?
What is the ratio of RMS power between the ship and the background?
RMS via a library function#
In the above, we calculate the RMS SPL directly based on the formula. Often we can use libraries that already have common metrics implemented to do the calculation, such as librosa.
Exercise
Try to compute and compare the RMS from the two signal segments above using librosa.feature.rms. Do you get the same values compared to when you did the calculation directly above?
Hint 1: If you don’t already have librosa in your environment, you can install it on the fly using
pip -q install librosa
You may need to restart the kernel to use the newly installed package.
Hint 2: To compute RMS of the whole signal, remember to set both frame_length and hop_length to the entire signal length, and set center=False. Not sure what these mean? It is always important to read the documentation so that we know what the function actually calculates and what each argument represents!