How do acoustic signals look/sound like?#
In previous sections, we talk about RL and sound captured by hydrophone as a single value. However, from our day-to-day experience, we know that different sounds have different durations, but are almost never a single time point. Indeed, the voltage time series is how sound signals captured by a hydrophone actually looks like.
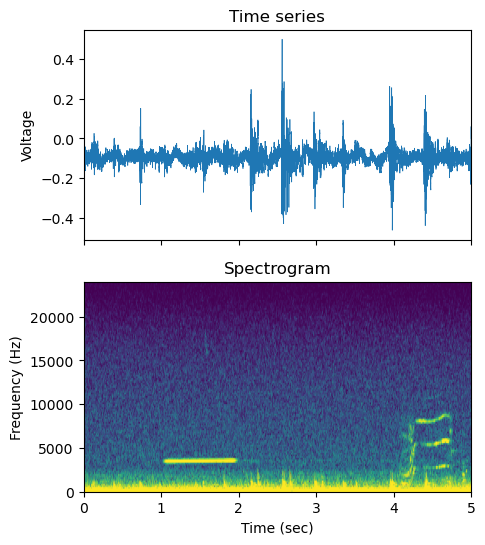
For example, below is a recording of a sonar transmission received on a moored hydrophone, along with cable drumming and sound from something else we can’t quite tell. One can usually get a basic understanding of the signal by looking its time series (what a hydrophone actually captures) and spectrogram, and listening to it.
Exercise
Looking at the figures below, can you see associate the temporal and spectral features you see with the sound you hear?
Tip
Spectrogram is a convenient way to visualizing how the frequency content of the signal changes across time. Check out the Time-frequency analysis primer to see how spectrograms are calcaulted if you are not already familiar with it.
Simple sinusoidal wave#
The simplest type of sound signal is a sinusoidal wave (a “sine wave”), defined by its frequency \(f\) (or its period \(T=1/f\)) and amplitude \(A\):
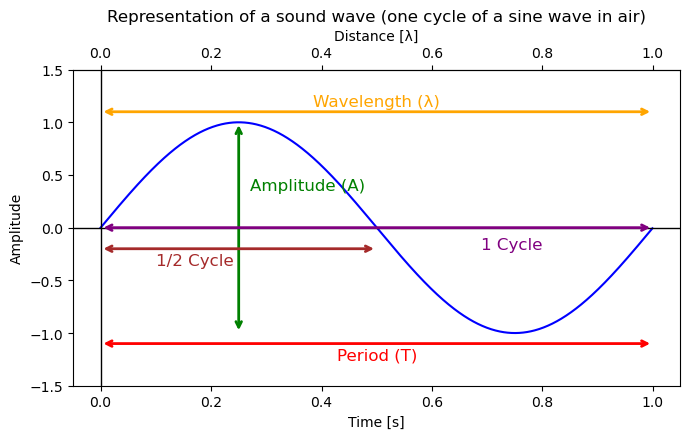
Figure credit: Audio Signal Processing Concepts Explained with Python.
Phase#
Another important concept is phase, which describes where in a sine wave a certain point is. We can understand phase intuitively by relating the signal with a revolving point on a unit circle as shown in the widget below.
<function __main__.plot_wave_and_circle(x_val)>
Exercise
Using this widget, where are you in the wave when you are at a phase angle of 135 degree?
Note
The concept of phase is key to understand constructive and destructive interference when waves are added together (superposition), which gives rise to the important topic of directionality as we shall see in How do acoustic signals look/sound like?.
Relationship with frequency#
For a sine wave propagating in a medium of sound speed \(c\), its wavelength \(\lambda\) is related to its frequency by
We will run into this over and over again in the tutorials, so let’s get an intuitive feel of how \(f\) and \(\lambda\) form an inverse relationship with each other, and how these relate to phase changes:
<function __main__.plot_wave_freq(freq, amplitude, x_val)>
Exercise
Based on what you have observed in the widget above, how does the phase of a wave change (faster or slower) within the same time interval when the frequency increases?
Tip
See the Basic signal types primer page to see other common signal types in addition to the sine wave.